
Michigan’s Population Studies Center
PSC was established in 1961 and has a rich history as an interdisciplinary community of scholars in population research and training. PSC is one of five centers within the University of Michigan’s Institute for Social Research (ISR).
PSC receives core funding from the Eunice Kennedy Shriver National Institute of Child Health & Human Development (P2CHD041028). The Population Dynamics and Health Program (PDHP) , which supports research in population health, is part of PSC.
News & Announcements
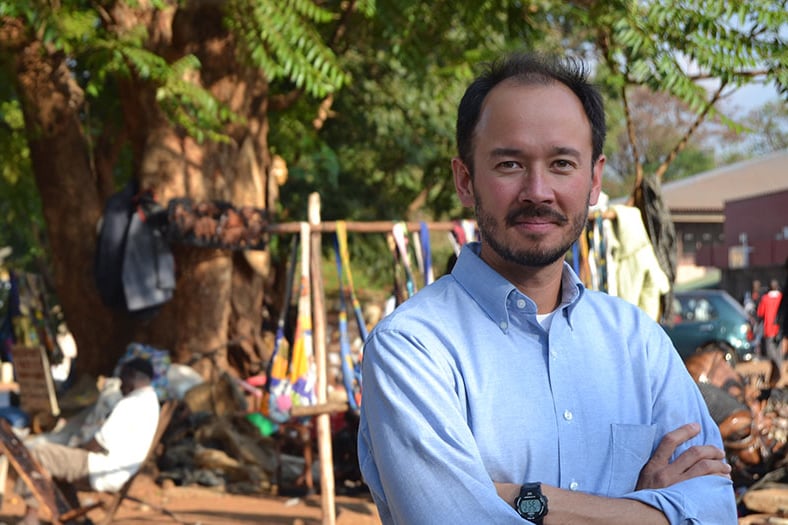
U-M economist Dean Yang named founding president of new international development economics association
A new global association led by University of Michigan economist Dean Yang aims to strengthen the field of development economics. The International Development Economics Association, or IDEA—the first global, open, and democratically governed professional association for development economists—has been established to advance the global production and dissemination of rigorous economic research. Its founding principles emphasize…
July 13, 2026
Alumna spotlight: Angubeen Khan
June 26, 2026
Faded letters, early warnings: A new clue for aging eyes
June 24, 2026
U-M economist Dean Yang named founding president of new international development economics association
June 1, 2026
Most people over 50 have LGBTQ+ friends or family, but LGBTQ+ people over 50 face more aging-related challenges, poll finds
May 26, 2026
ISR welcomes the 2026 Junior Professional Researcher cohort
May 26, 2026
Next Generation Initiative funds helped Holly Donahue Singh build an interdisciplinary perspective
May 11, 2026
U-M research spending generates $164M for Michigan businesses
April 29, 2026
Research Experiment: Sharing a Family Photo Helps Migrant Workers Elicit Employer Empathy
PSC Events Calendar
July 2026
August 2026
BlueSky Feed
PSC Small Grants
Private gifts are a true investment in the research and training conducted at the Population Studies Center. They are used to support graduate students, young faculty, and international scholars, and to seed small research projects.
Currently six funds have been established at PSC. Learn more about these funds— those they honor, and the work they support– or browse all PSC Small Grants awarded.